Overview
When a WPF Binding does not work as expected, the control shows nothing or keeps its default value.
No exception is raised, which makes the cause hard to locate.
WPF, however, does not silently ignore a binding failure.
It records the details as a trace in the Visual Studio Output window.
Reading that trace reveals which property failed, on which data context, and why the binding could not resolve.
This article explains how binding errors appear in the Output window, how to read the structure of an error message, how to raise the trace level, and how to handle typical error patterns.
The goal is to make initial triage rely on trace output rather than guesswork.
Prerequisites / Environment
- Framework / Language: .NET 10 / C# 14 (also applicable to .NET Framework 4.x)
- Target: WPF data binding (
Binding) - IDE: Visual Studio 2026
- Architecture: MVVM (binding through
DataContext) - Assumed knowledge: WPF binding basics,
INotifyPropertyChanged - Verification environment: .NET 10 / Windows 11 (the trace output shown here was measured in this environment)
How Binding Errors Appear in the Output Window
WPF binding emits diagnostic information through the DataBindingSource of System.Diagnostics.PresentationTraceSources.
When a binding fails to resolve, WPF writes a warning-level message to this trace source.
During a debug session, that message appears in the Output window (View → Output, or Ctrl+Alt+O) under “Show output from: Debug”.
If the Output window shows nothing, check the following.
- The “Show output from” dropdown is set to “Debug”.
- Under Tools → Options → Debugging → Output Window, the WPF trace setting for “Data Binding” is set to something other than “Off”.
A key point is that a binding error is not an exception.
It cannot be caught with try/catch, and it does not stop execution.
The trace output is the only clue, so the Output window is the first place to check when a binding does not work.
Reading the Structure of a Binding Error Message
A typical binding error in the Output window has the following form.
The example below is produced by binding to a non-existent property UserNam (the correct name is UserName).
System.Windows.Data Error: 40 : BindingExpression path error:
'UserNam' property not found on 'object' ''MainViewModel' (HashCode=12345678)'.
BindingExpression:Path=UserNam; DataItem='MainViewModel' (HashCode=12345678);
target element is 'TextBox' (Name='userNameBox');
target property is 'Text' (type 'String')
The message is made of several parts, each of which is a clue for locating the cause.
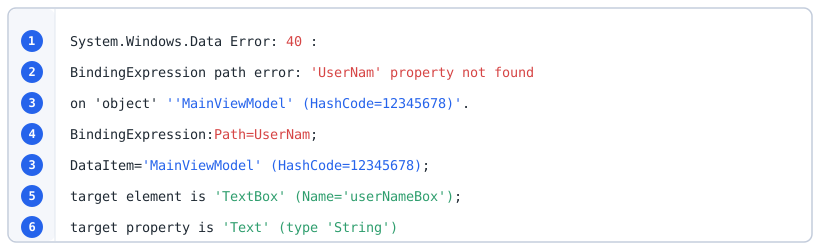
# column of the table below. Number 3 appears twice because the same information is repeated in DataItem.The meaning of each part is as follows.
| # | Part | Content | What it reveals |
|---|---|---|---|
| 1 | Error: 40 |
Error number | The kind of error (40 is a path resolution failure) |
| 2 | path error: 'UserNam' property not found |
The failure | Which property name could not be resolved |
| 3 | on 'object' ''MainViewModel' |
The searched type | Which object (DataItem) was searched. Usually the DataContext, but it is the object named by Source, RelativeSource, or ElementName when one of those is specified |
| 4 | BindingExpression:Path=UserNam |
The binding path | The path string written in XAML |
| 5 | target element is 'TextBox' (Name='userNameBox') |
The target element | Which control is affected |
| 6 | target property is 'Text' |
The target property | Which dependency property is affected |
This error reads as follows.
The Text property of the TextBox named userNameBox looked for a UserNam property on a data context of type MainViewModel and did not find it.
The cause is therefore a typo or a property missing from the ViewModel.
If the DataItem type name differs from the expected ViewModel, a missing DataContext assignment is the likely cause.
Raising the Trace Level (PresentationTraceSources.TraceLevel)
By default, the trace is emitted only on failure.
To inspect the resolution process step by step, use the PresentationTraceSources.TraceLevel attached property to raise the verbosity for a specific binding.
Because this attached property applies to an individual Binding, the output can be limited to the binding under investigation.
Declare the trace namespace in XAML and set TraceLevel=High on the target Binding.
<Window ...
        xmlns:diag="clr-namespace:System.Diagnostics;assembly=WindowsBase">
    <TextBox Text="{Binding UserName,
                    diag:PresentationTraceSources.TraceLevel=High}" />
</Window>
With TraceLevel=High, the binding emits detailed traces including DataContext resolution, evaluation of each path stage, and value conversion, even when the binding succeeds.
For cases where a binding appears to succeed but no value is shown, this detailed trace helps track the stage at which the value diverges from what is expected.
Because detailed tracing produces a large amount of output, remove the setting once triage is complete.
Common Error Patterns and How to Handle Them
The wording in the Output window differs by cause.
The table below records what actually reaches the System.Windows.Data trace when each pattern is evaluated.
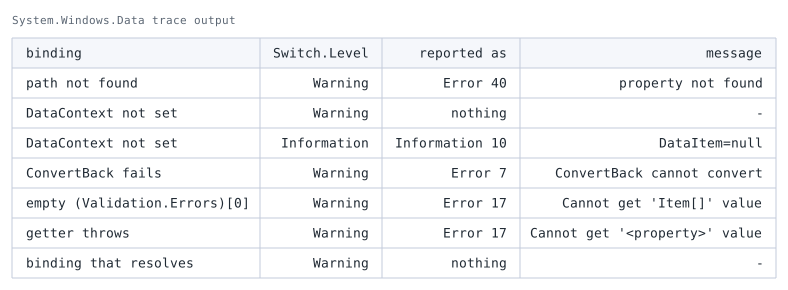
PresentationTraceSources.DataBindingSource. Switch.Level is Warning, matching the default, except for the extra DataContext row where it is lowered to Information.On .NET 10 / Windows 11, Error: 40 corresponds to path resolution, Error: 7 to a ConvertBack conversion failure, and Error: 17 to a failure while retrieving the value.
These numbers are identifiers assigned by the internal implementation behind the System.Windows.Data trace, not a public API contract guaranteed to stay fixed across versions. Read the accompanying message text rather than relying on the number alone.
Error: 17 is also not limited to indexer access; it is emitted whenever an exception occurs while retrieving the value.
An unset DataContext is the exception: it is not reported as a numbered error at all. That difference is the starting point for diagnosis, so it is covered separately below.
Path Resolution Failure (Error: 40)
A message containing property not found indicates that the name given in the path does not exist on the data context.
A typo in the property name, an accessor that is not public, or the wrong DataContext type causes this.
Check the DataItem type name in the message and confirm that a public property with that name exists on the type.
When DataItem names the element type of a collection instead of the expected view model, a common cause is that the DataContext switches to each item inside a DataTemplate (see Binding to the Parent DataContext from Inside a WPF DataTemplate).
Bindings written in an ItemContainerStyle setter resolve against the item as well, so the same error appears when the item type lacks the property (see Selecting and Expanding a WPF TreeView Node from Code, and Why SelectedItem Is Read-Only).
Referencing a dependency property defined on a UserControl with a plain {Binding} from inside that same control surfaces the same way, provided the inherited DataContext is non-null and lacks that property (see Binding to a WPF UserControl’s Own Dependency Property from Inside the Control).
DataContext Not Set (DataItem=null) — Nothing Is Printed by Default
This pattern alone produces no output in the Output window under the default trace settings.
WPF does not treat a binding evaluated against a null DataContext as an error.
Measured, the DataItem=null state is recorded as Information: 10 rather than an error.
System.Windows.Data Information: 10 : Cannot retrieve value using the binding
and no valid fallback value exists; using default instead.
BindingExpression:Path=UserName; DataItem=null;
target element is 'TextBox' (Name=''); target property is 'Text' (type 'String')
The default trace covers Error and Warning, so this line never appears.
To see it, set PresentationTraceSources.TraceLevel on the binding as described above, or lower System.Diagnostics.PresentationTraceSources.DataBindingSource.Switch.Level to Information or below.
Note that an unset DataContext also suppresses the path resolution error (Error: 40).
With a null binding source, evaluation never reaches the stage where the property is looked up.
An empty Output window therefore does not mean the binding is correct.
When a value fails to appear and no trace is produced, the first thing to suspect is an unset DataContext.
As for the fix, review the initialization order, or assign the DataContext after the element has loaded.
Because the binding is re-evaluated once the DataContext is assigned, a temporary DataItem=null right after initialization is sometimes not a problem.
Type Conversion Failure (Error: 7 and similar)
A message containing ConvertBack cannot convert value or Cannot convert indicates that a value cannot be converted to the bound type.
This occurs, for example, when a string is two-way bound to a numeric property and the input cannot be converted to a number, producing Error: 7 on the ConvertBack side.
Implement the ConvertBack method of an IValueConverter that turns the input string back into the number, or validate the input with a ValidationRule before conversion.
Note that StringFormat only affects display formatting on the Convert side and does not resolve a ConvertBack conversion failure, so it is not used for this purpose.
Collection Indexer Access Failure (Error: 17)
A message containing Cannot get 'Item[]' value indicates that access to a collection indexer failed.
The typical case is a validation message displayed through a binding to (Validation.Errors)[0].ErrorContent.
The path is evaluated the moment the error clears and the collection becomes empty, raising an ArgumentOutOfRangeException internally.
The display itself clears correctly, so the trace is easy to miss.
Rewriting the path as (Validation.Errors)/ErrorContent, which refers to the current item, keeps the same display and produces no trace (see Why WPF Validation Errors Are Not Displayed, and Choosing Between IDataErrorInfo and INotifyDataErrorInfo).
Collection Changes Are Not Reported
When no error appears but a list does not update, change notification for the collection itself is missing.
List<T> does not report additions and removals, so use ObservableCollection<T>.
Property changes on individual items are reported through INotifyPropertyChanged on the item.
Aggregating Traces to a File or Console (TraceListener)
The Output window is only available during a debug session.
To review binding errors that occur in a test environment or during integration testing, register a TraceListener and aggregate the binding traces to listeners such as a file or console.
Adding a listener to PresentationTraceSources.DataBindingSource lets the application receive binding-related traces.
At application startup, configure the listener and switch level on DataBindingSource.
using System.Diagnostics;
using System.Windows;

public partial class App : Application
{
    protected override void OnStartup(StartupEventArgs e)
    {
        base.OnStartup(e);

        PresentationTraceSources.Refresh();

        var source = PresentationTraceSources.DataBindingSource;
        source.Switch.Level = SourceLevels.Warning;
        source.Listeners.Add(new TextWriterTraceListener("binding-errors.log"));
        source.Listeners.Add(new ConsoleTraceListener());
    }
}
Calling PresentationTraceSources.Refresh() beforehand ensures the trace source settings take effect.
This code writes binding warnings to binding-errors.log.
Output from ConsoleTraceListener appears only when a console is attached, such as when a console is allocated or a debugger is connected.
A typical WPF GUI app has no console by default, so rely on the file listener for durable records.
Leaving it enabled in a release build increases output volume and file size, so enable it only for diagnostic builds or during investigation.
Also note that setting Switch.Level below Warning prevents failure traces from being recorded.
Notes
- A binding error is not an exception.
It cannot be caught withtry/catchand does not stop execution, so read the Output window trace before guessing when a binding fails. - A released binary has no accessible Output window.
Binding tracing assumes a debug session, so handle production investigation withTraceListeneraggregation instead. DataItem=nullis not always a defect.
It can appear as a transient state right after initialization, and is not a problem if theDataContextis assigned afterward and the value displays correctly.- Detailed tracing produces a lot of output.
LeavingTraceLevel=Highin place makes the Output window verbose, so remove the setting once triage is complete. - Error numbers are only an indication of kind.
Numbers such as 40 or 7 help classify the cause, but the definitive information is in the message body such asproperty not foundorCannot convert. - When the trace is silent but the change is not reflected, suspect value precedence.
Even with a correctly resolved binding, a local value on the target property keeps the value supplied by a style trigger from becoming the effective value (see Why WPF Style Triggers and DataTriggers Do Not Apply — Dependency Property Value Precedence). - The Output window also separates the two stages of application shutdown.
Placing aTrace.WriteLinein theAppoverride ofApplication.OnExitand checking whether that line appears distinguishes “WPF never shut down” from “only the process survives” (see Diagnosing a WPF Process That Stays Alive After the Window Closes — ShutdownMode and Foreground Threads).
Summary
Because WPF binding errors raise no exception, the Output window trace is the first clue.
Choose the triage method by situation.
| Situation | Method | Purpose |
|---|---|---|
| Binding does not work (initial triage) | Output window trace | Read the error number, path, and DataItem |
| Succeeds but shows no value | PresentationTraceSources.TraceLevel=High |
Follow the resolution process step by step |
| Need to inspect outside a debug session | TraceListener to a file / console |
Review the log after execution |
| A list does not update | Reconsider the collection type | Use ObservableCollection<T> |
First, read the Output window message to distinguish between property not found, DataItem=null, and Cannot convert, and set the direction of the cause.
If the resolution process of a specific binding must be followed, use TraceLevel=High; if inspection outside a debug session is required, aggregate traces with a TraceListener.
Selecting among these by situation makes it possible to locate a failing binding from trace evidence rather than guesswork.